Once upon a time, a colleague asked me to look into a customer database with weird spikes in database log usage. (You might start to wonder why I am always the one who looks into weird things—is there a pattern here?)
Upon reviewing the query store, I noticed very high logical reads related to tblScheduledItem. From past experience, it was likely due to index fragmentation (the table has only one clustered index). A quick look confirmed high fragmentation. I suggested rebuilding the index and moved on.
A few days later, the colleague pinged me again. Apparently, they rebuilt it—but it didn’t help. That raised my eyebrows, so I dug deeper.
To my surprise, fragmentation wasn’t the real issue (though it contributed). The problem was a column of type nvarchar(max) used to record output from the Execute method of the scheduled job. It was meant for short messages like:
- “The job failed successfully”
- “Deleted 12345 versions from 1337 contents”
But being nvarchar(max), it could store entire libraries if you wanted. And just because you can, doesn’t mean you should. Long columns make every read a burden on SQL Server. The offending job? Our S&N indexing job.
Any job could cause this, but S&N indexing is more prone because:
- It tracks every exception thrown during indexing
- It indexes nearly every content item unless explicitly excluded
- Recurring issues affect many items, amplifying the problem
I asked them to trim the column and fix any exceptions. While I was off, my colleague messaged me: the job had run for 10 hours without errors. Curious, I checked the stats. Let the screenshots speak:
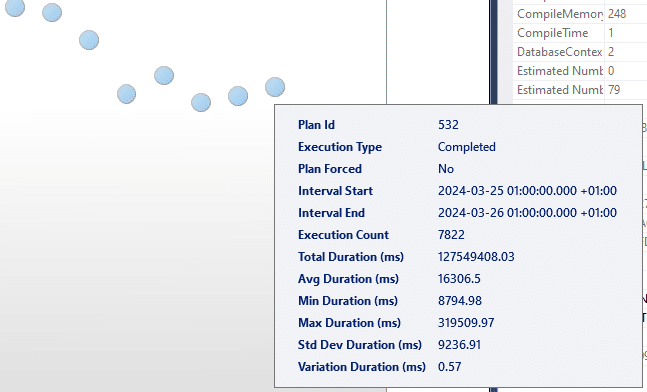
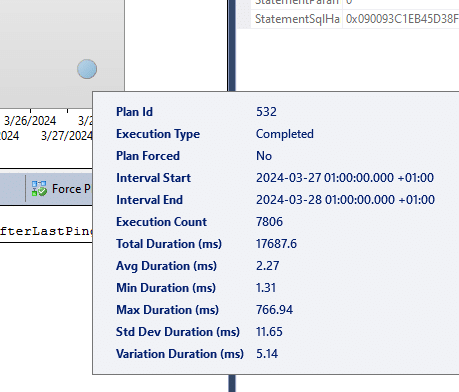
The query dropped from 16,000ms to 2.27ms. Logical reads went from 3.5GB to 100KB. That’s a massive resource save.
So: make sure your job isn’t throwing errors. And fix your S&N indexing job.
P/S: I think the S&N job should return something simpler like:
“Indexed 100,000 content with 1,234 errors”
Exceptions could be logged separately. But that’s debatable. For now—do your part!